The planet’s health is quantifiable, and understanding environmental damage metrics has become essential for crafting effective sustainability strategies and securing our collective future.
🌍 Why Measuring Environmental Impact Matters More Than Ever
In an era where climate change headlines dominate news cycles and extreme weather events become increasingly common, the ability to track and measure environmental damage has transformed from an academic exercise into a survival imperative. Environmental metrics provide the hard data needed to move beyond anecdotal evidence and emotional appeals, offering concrete numbers that policymakers, businesses, and individuals can use to make informed decisions.
The challenge lies not in recognizing that environmental damage exists, but in quantifying its extent, understanding its trajectory, and identifying the most effective intervention points. Without reliable metrics, sustainability efforts risk becoming performative gestures rather than meaningful action. Numbers tell stories that words sometimes cannot—they reveal patterns, expose inequalities, and hold stakeholders accountable.
Environmental damage metrics serve multiple critical functions: they establish baselines against which progress can be measured, they identify hotspots requiring urgent intervention, they enable comparative analysis across regions and sectors, and they provide the evidence base for policy formulation. Perhaps most importantly, they make the invisible visible, transforming abstract concepts like carbon emissions or biodiversity loss into tangible, trackable quantities.
📊 The Core Metrics: What We’re Actually Measuring
Environmental damage manifests across multiple dimensions, each requiring specific measurement approaches and methodologies. Understanding the primary metrics provides a framework for comprehending the scope of environmental challenges.
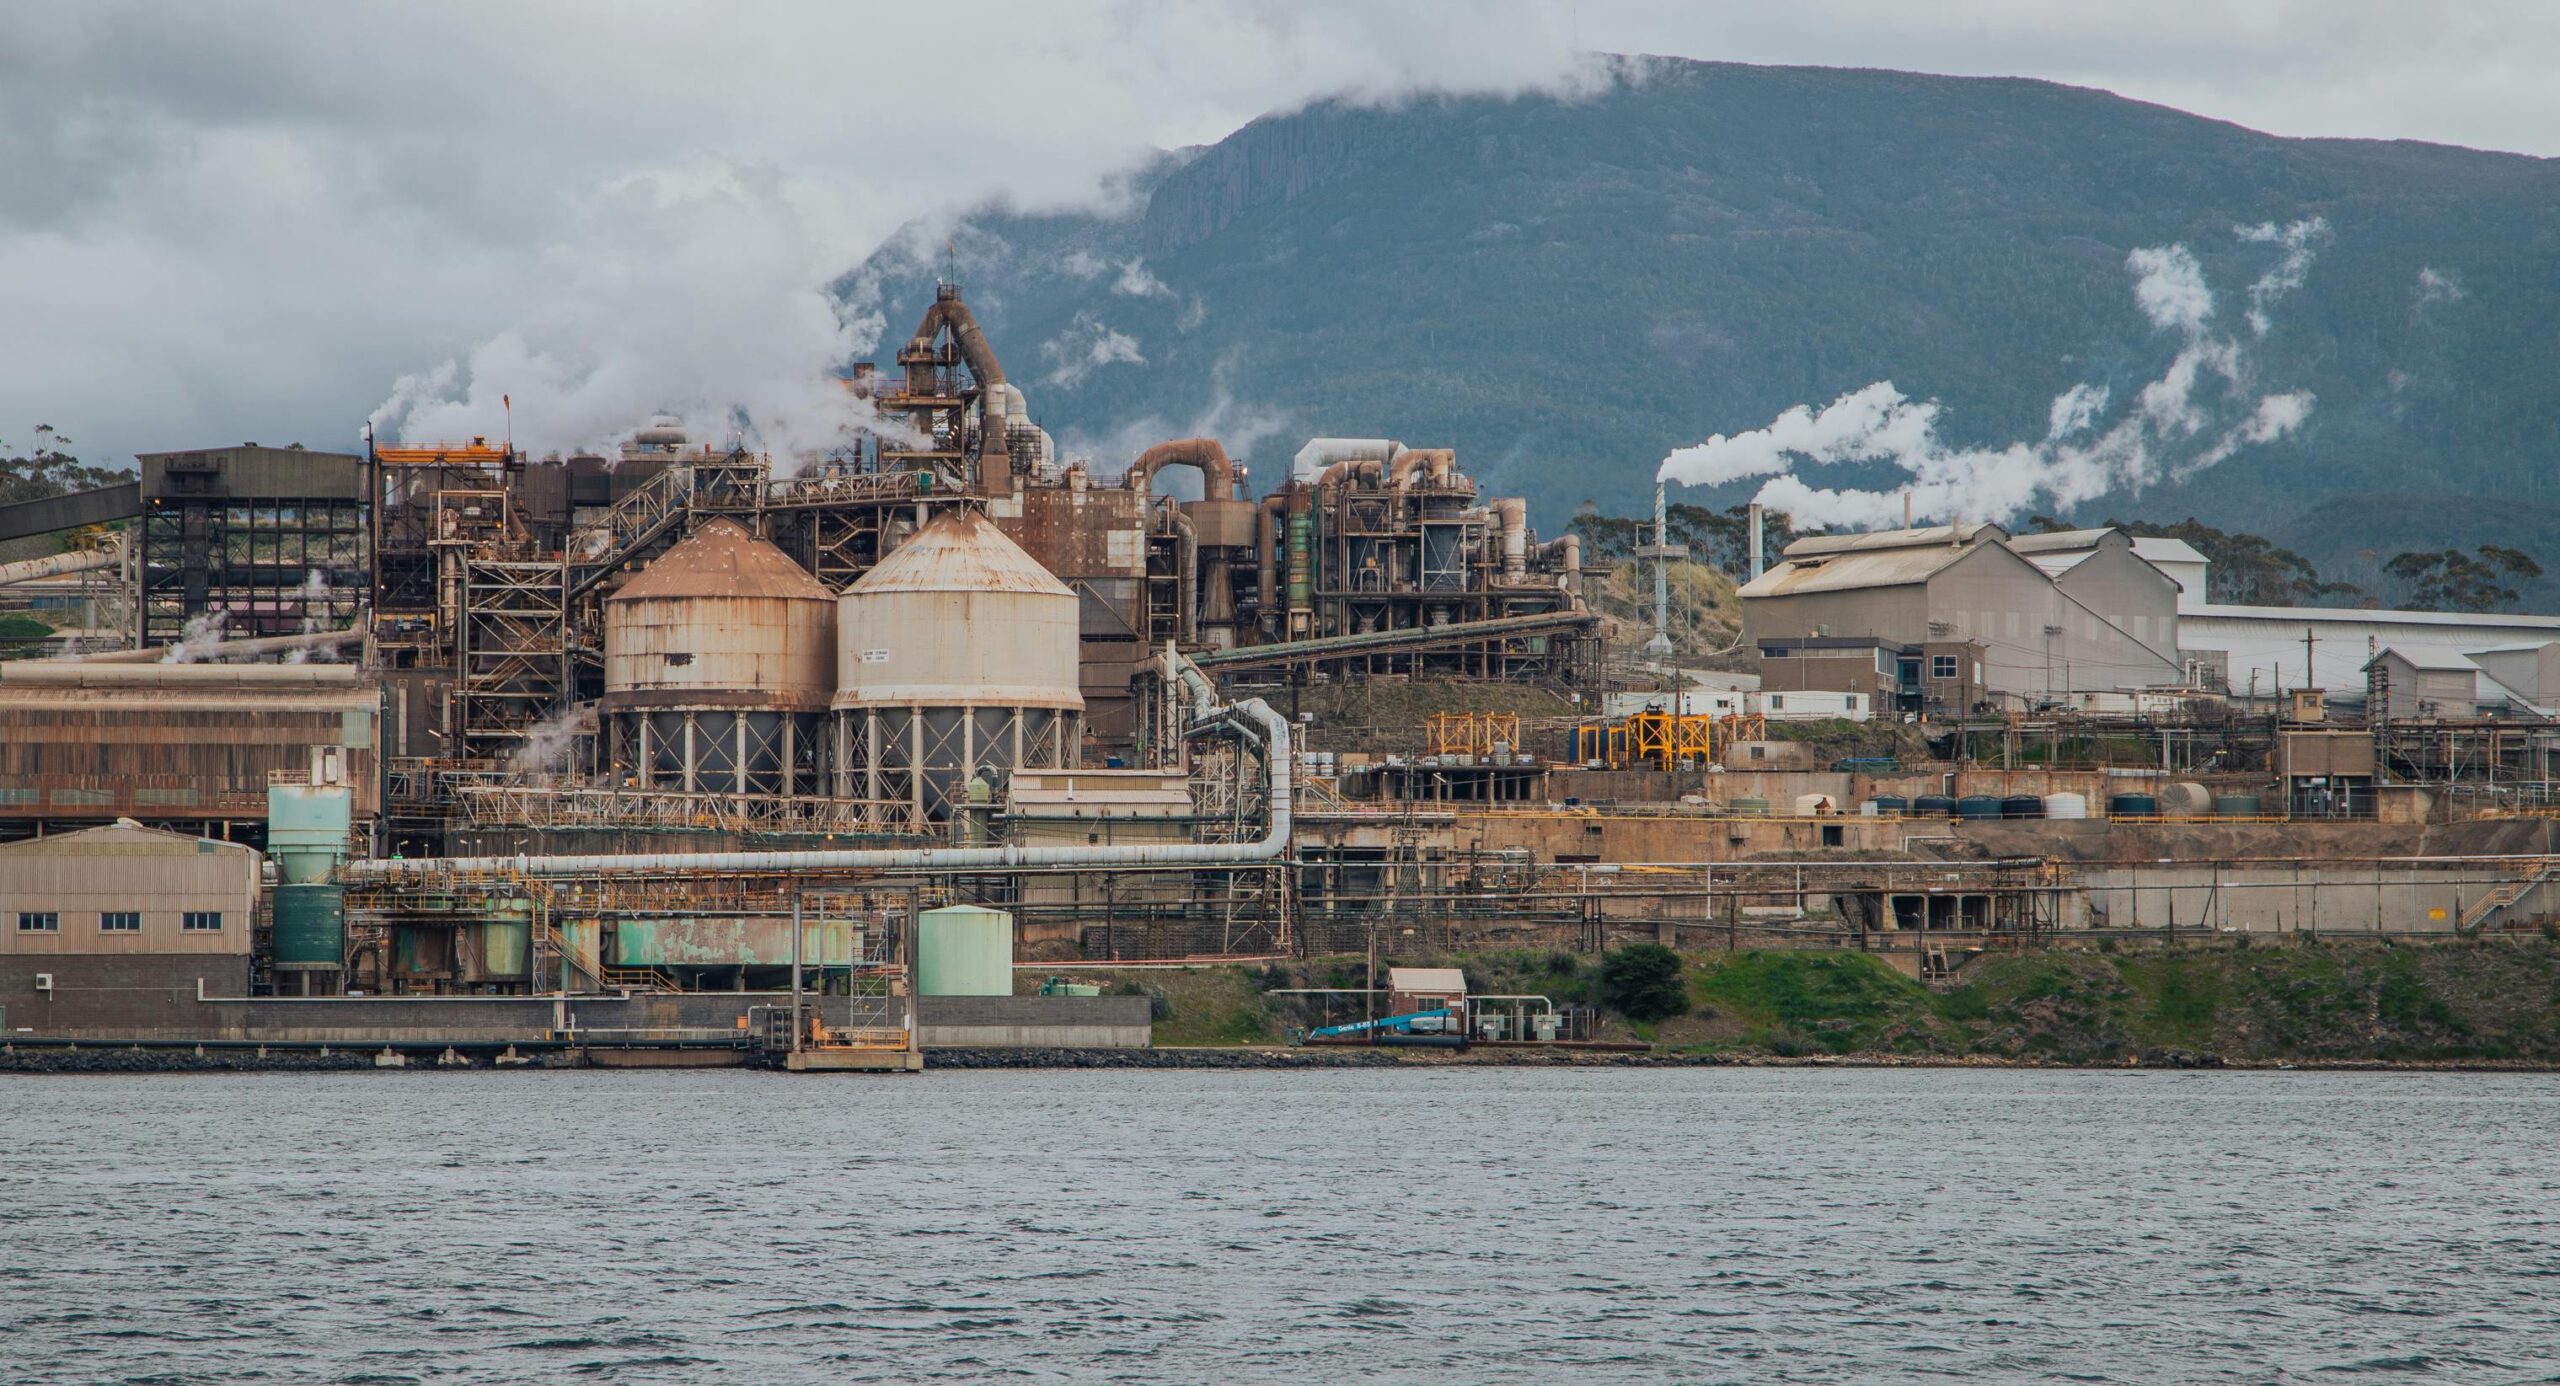
Carbon Footprint and Greenhouse Gas Emissions
Carbon dioxide equivalent (CO2e) has become the universal language of climate impact measurement. This metric consolidates various greenhouse gases—including methane, nitrous oxide, and fluorinated gases—into a single comparable unit based on their global warming potential. Countries, corporations, and even individuals now track their carbon footprints, measured in metric tons of CO2e annually.
Global emissions currently hover around 50 billion tons of CO2e per year, with fossil fuel combustion accounting for approximately 73% of total emissions. Transportation contributes 16%, agriculture 18%, and energy use in buildings 17%. These numbers provide clear targets for reduction efforts and enable stakeholders to prioritize high-impact interventions.
Biodiversity Loss and Species Decline
The Living Planet Index, which tracks populations of mammals, birds, fish, reptiles, and amphibians, reveals a devastating 69% average decline since 1970. This metric aggregates data from thousands of species populations worldwide, providing a quantifiable measure of biodiversity health. Species extinction rates now exceed natural background rates by 100 to 1,000 times, signaling what many scientists term the sixth mass extinction event.
Habitat loss metrics complement species tracking, with forests disappearing at a rate of 10 million hectares annually—an area roughly the size of Iceland. Wetlands have declined by 35% since 1970, while coral reefs have experienced 50% loss over the past 150 years. These numbers paint a stark picture of ecosystem degradation.
Water Quality and Scarcity Indicators
Water stress affects over 2 billion people globally, with metrics tracking both quantity and quality dimensions. The Water Stress Index measures the ratio of water withdrawal to available renewable water resources, with values above 25% indicating significant stress. Currently, 17 countries containing one-quarter of the world’s population face extremely high water stress.
Water quality metrics include measurements of chemical pollutants, biological oxygen demand, pH levels, and presence of harmful pathogens. Approximately 80% of wastewater globally is discharged without adequate treatment, contributing to 1.8 million deaths annually from waterborne diseases.
Air Quality Measurements
The Air Quality Index (AQI) translates complex pollutant concentrations into accessible public health guidance. Particulate matter (PM2.5 and PM10), nitrogen dioxide, sulfur dioxide, ozone, and carbon monoxide levels combine to create composite scores that categorize air quality from good to hazardous. Globally, 99% of the population breathes air exceeding WHO guideline limits, with air pollution contributing to 7 million premature deaths annually.
🔬 Advanced Tracking Technologies Revolutionizing Data Collection
The accuracy and granularity of environmental metrics have improved dramatically through technological innovation, enabling real-time monitoring and unprecedented analytical capabilities.
Satellite-Based Environmental Monitoring
Earth observation satellites now provide continuous global coverage, tracking deforestation, ice sheet melting, ocean temperature changes, and atmospheric composition with remarkable precision. NASA’s Landsat program, operational since 1972, offers decades of comparative data, enabling scientists to identify long-term trends. The European Space Agency’s Copernicus program delivers free, open-access satellite imagery that researchers, governments, and NGOs worldwide utilize for environmental monitoring.
Synthetic Aperture Radar (SAR) technology penetrates cloud cover and operates day and night, overcoming traditional optical imaging limitations. This capability proves especially valuable in monitoring tropical deforestation and tracking illegal fishing activities in remote ocean areas.
IoT Sensors and Ground-Based Networks
Internet of Things (IoT) sensors deployed across landscapes create dense monitoring networks that capture environmental data at micro-scales. Smart sensors measure soil moisture, air quality, water contamination, and noise pollution continuously, transmitting data wirelessly to central databases. These ground-truth measurements validate and calibrate satellite observations while capturing localized variations that orbital platforms might miss.
Citizen science initiatives leverage smartphones and low-cost sensors to crowdsource environmental data collection. Applications enable individuals to report pollution incidents, document wildlife sightings, and measure local air quality, dramatically expanding monitoring coverage while engaging communities in environmental stewardship.
Artificial Intelligence and Predictive Analytics
Machine learning algorithms process vast environmental datasets, identifying patterns invisible to human analysts and generating predictive models. AI systems can forecast deforestation hotspots, predict water scarcity events, and model climate change impacts with increasing accuracy. These capabilities enable proactive rather than reactive interventions, potentially preventing environmental damage before it occurs.
Natural language processing analyzes news reports, social media, and scientific literature to detect emerging environmental threats and track public sentiment toward sustainability issues. This meta-analysis provides context for quantitative metrics, revealing how environmental challenges intersect with social and economic factors.
💼 Corporate Environmental Accounting: When Business Meets Sustainability
The private sector increasingly recognizes that environmental metrics aren’t just ethical considerations but material business risks and opportunities. Corporate environmental accounting has evolved from voluntary disclosure to mandatory reporting in many jurisdictions.
The Task Force on Climate-related Financial Disclosures (TCFD) framework requires companies to report climate risks and emissions across three scopes: direct emissions from owned operations (Scope 1), emissions from purchased energy (Scope 2), and indirect value chain emissions (Scope 3). Scope 3 typically represents 70-90% of corporate carbon footprints but proves most challenging to measure accurately.
Environmental, Social, and Governance (ESG) metrics now influence investment decisions worth trillions of dollars. Asset managers screen companies based on environmental performance indicators, rewarding sustainability leaders with lower capital costs and punishing laggards with divestment. This financialization of environmental metrics creates powerful market incentives for improved corporate behavior.
Life Cycle Assessment (LCA) methodologies quantify environmental impacts across product lifecycles from raw material extraction through disposal. Companies use LCA results to identify improvement opportunities, substantiate marketing claims, and compare alternatives. However, LCA complexity and data requirements sometimes limit accessibility for smaller enterprises.
🏛️ Policy Applications: Turning Metrics into Meaningful Action
Environmental metrics only fulfill their potential when translated into effective policy interventions. Governments worldwide increasingly base regulatory frameworks on quantifiable environmental indicators.
Carbon pricing mechanisms—whether carbon taxes or cap-and-trade systems—depend entirely on accurate emissions measurement. Currently, 64 carbon pricing initiatives operate globally, covering 21% of worldwide greenhouse gas emissions. Pricing effectiveness hinges on robust monitoring, reporting, and verification (MRV) systems that prevent gaming and ensure compliance.
Environmental quality standards establish legally enforceable thresholds for pollutants based on health and ecological impact assessments. The Clean Air Act in the United States, for example, mandates National Ambient Air Quality Standards for six criteria pollutants, with compliance tracked through extensive monitoring networks. Violations trigger enforcement actions, creating accountability for environmental performance.
Sustainable Development Goals (SDGs) adopted by United Nations member states include 169 targets tracked by 231 unique indicators, many focused on environmental dimensions. This comprehensive metrics framework enables countries to benchmark progress, identify policy gaps, and mobilize resources toward agreed objectives. The indicator-based approach transforms abstract sustainability commitments into concrete, measurable outcomes.
🌱 Personal Environmental Footprints: Individual Responsibility in the Digital Age
Environmental metrics have democratized, enabling individuals to quantify personal impacts and make informed lifestyle choices. Carbon footprint calculators proliferate online, estimating individual emissions based on transportation patterns, dietary choices, housing characteristics, and consumption habits.
The average American generates approximately 16 tons of CO2e annually—more than double the global average and four times the level consistent with limiting warming to 2°C. These personal metrics reveal significant variation based on lifestyle choices: vegetarians typically have carbon footprints 20-30% lower than meat-eaters, and those living car-free can reduce personal emissions by 2-3 tons annually.
Mobile applications now translate daily activities into environmental impacts, providing real-time feedback that encourages sustainable behaviors. These tools track miles traveled by different transportation modes, estimate food waste, calculate water usage, and even assess the environmental footprint of purchases through barcode scanning.
However, critics caution against overemphasizing individual responsibility while minimizing systemic factors. Personal carbon footprints, while useful educational tools, can obscure the reality that 71% of global emissions originate from just 100 companies. Effective climate action requires both individual behavior change and structural economic transformation.
⚠️ The Measurement Challenge: Limitations and Uncertainties
Despite technological advances, environmental measurement involves inherent uncertainties and methodological challenges that complicate interpretation and decision-making.
Remote and inaccessible regions remain poorly monitored, creating data gaps that limit comprehensive assessment. The deep ocean, representing 95% of Earth’s biosphere, remains largely unmapped and unmonitored. Similarly, illegal activities like unreported deforestation and fishing evade tracking systems, causing official statistics to underestimate actual damage.
Measurement standardization challenges arise when different methodologies produce incompatible results. Carbon footprint calculations, for example, vary significantly depending on system boundaries, emission factors, and allocation approaches. This methodological pluralism complicates comparisons and enables selective reporting that presents favorable rather than accurate pictures.
Time lag issues affect many environmental metrics. Greenhouse gas effects manifest over decades, while biodiversity impacts may not become apparent until populations reach critical thresholds. This temporal disconnect between actions and measurable consequences hinders cause-effect attribution and delays corrective responses.
Furthermore, ecosystems involve complex interactions that resist simple quantification. Reducing environmental health to numerical indicators necessarily simplifies reality, potentially overlooking emergent properties and tipping points that don’t appear in conventional metrics. Indigenous and local knowledge systems often capture ecosystem dynamics that scientific metrics miss.
🚀 Emerging Frontiers: Next-Generation Environmental Metrics
Innovation in environmental measurement continues advancing, with emerging approaches promising more comprehensive, accurate, and actionable insights.
DNA environmental sampling (eDNA) enables biodiversity assessment by analyzing genetic material in water, soil, or air samples. This technique detects species presence without direct observation, dramatically increasing survey efficiency while reducing costs and invasiveness. Researchers can now assess entire ecosystem communities from single environmental samples, revolutionizing biodiversity monitoring.
Planetary boundaries framework identifies nine critical Earth system processes—climate change, biosphere integrity, biogeochemical flows, ocean acidification, land use, freshwater use, ozone depletion, atmospheric aerosol loading, and novel entities. Quantifying safe operating spaces for each process provides integrated risk assessment transcending single-issue metrics. Currently, humanity has transgressed safe boundaries for at least four systems, indicating dangerous destabilization.
Natural capital accounting extends beyond traditional economic GDP to incorporate environmental assets and ecosystem services. By monetizing nature’s contributions—from pollination to water purification—this approach enables cost-benefit analyses that include environmental considerations. The System of Environmental-Economic Accounting (SEEA) provides internationally agreed standards for natural capital measurement, with over 90 countries implementing related programs.
Digital twins—virtual replicas of physical environments updated with real-time sensor data—enable scenario modeling and predictive analytics. Cities deploy urban digital twins to optimize resource flows, test policy interventions, and visualize environmental impacts before implementing physical changes. This capability transforms environmental management from reactive to anticipatory.
🌐 Global Cooperation: The International Architecture of Environmental Monitoring
Environmental challenges transcend borders, requiring coordinated international measurement and reporting systems. Several multilateral frameworks facilitate global environmental tracking.
The Intergovernmental Panel on Climate Change (IPCC) synthesizes climate science worldwide, establishing measurement protocols and assessment methodologies that standardize global climate tracking. IPCC reports, based on thousands of peer-reviewed studies, represent the authoritative consensus on climate change metrics and projections.
The Global Environment Facility (GEF) funds environmental monitoring projects in developing countries, building capacity for consistent data collection across regions with varying technical capabilities. This financial mechanism recognizes that comprehensive global environmental assessment requires universal participation supported by resource transfers.
The Convention on Biological Diversity establishes reporting obligations for member countries, creating comparable biodiversity datasets globally. National biodiversity strategies must include measurable targets and indicators, enabling progress tracking toward international conservation commitments.
✨ From Numbers to Action: Making Metrics Matter
The ultimate value of environmental metrics lies not in measurement itself but in the decisions and actions they inform. Translating data into meaningful change requires deliberate strategies that connect measurement to intervention.
Transparency initiatives publish environmental metrics publicly, leveraging reputational incentives and stakeholder pressure. Corporate sustainability reports, government environmental accounts, and academic research databases make environmental performance visible, enabling informed consumer choices, investment decisions, and voting behavior. Sunlight proves a powerful disinfectant when environmental damage becomes visible through accessible metrics.
Target-setting transforms abstract metrics into concrete objectives. The Paris Agreement’s nationally determined contributions, corporate net-zero commitments, and municipal climate action plans establish specific, measurable goals tied to timeframes. This approach creates accountability mechanisms and enables progress tracking while motivating sustained effort.
Adaptive management frameworks use metrics to evaluate intervention effectiveness continuously, adjusting strategies based on measured outcomes. Rather than implementing fixed policies regardless of results, adaptive approaches treat management as experimentation, with environmental metrics providing feedback that guides iterative improvement.
Education and communication strategies must bridge the gap between technical metrics and public understanding. Data visualization, narrative storytelling, and relatable analogies help audiences grasp abstract numbers’ real-world implications. When people understand what metrics mean for their lives, communities, and descendants, numbers acquire emotional resonance that motivates behavioral change.

🌟 Building Environmental Intelligence for Tomorrow
As environmental pressures intensify, the sophistication and importance of damage tracking metrics will only increase. Future sustainability depends on our collective ability to measure accurately, interpret wisely, and act decisively based on environmental intelligence.
Investment in monitoring infrastructure represents essential climate adaptation and mitigation spending. Comprehensive environmental data systems enable early warning of emerging threats, efficient resource allocation toward high-impact interventions, and evidence-based policy that maximizes benefits while minimizing costs. The return on measurement investment far exceeds initial outlays when improved decisions prevent irreversible environmental damage.
Interdisciplinary collaboration between natural scientists, social scientists, technologists, and policymakers will strengthen environmental metrics. Complex sustainability challenges require integrated approaches that combine biophysical measurements with socioeconomic indicators and behavioral insights. Breaking down disciplinary silos creates holistic understanding that purely technical metrics cannot achieve alone.
Democratic participation in environmental monitoring empowers communities while expanding data collection capabilities. Citizen science, participatory mapping, and community-based monitoring recognize that those most affected by environmental degradation possess valuable knowledge that complements expert measurement. Inclusive approaches to environmental intelligence yield both better data and stronger social foundations for sustainability transitions.
The numbers we track today shape the world we inhabit tomorrow. Environmental damage metrics provide the compass guiding humanity toward sustainability or the warning signs of impending collapse. By unveiling these numbers, understanding their implications, and translating quantitative insights into qualitative improvements in how we inhabit Earth, we harness measurement’s transformative power. The path to a sustainable tomorrow begins with knowing precisely where we stand today—and environmental metrics illuminate that starting point with unprecedented clarity.